Last week, i posted about land cover for Burkina Faso, and i came across this post that remained as a draft on my blog for half a year at least. Time to get it out there! Joanne Morris, a colleague of mine from SEI York did quite some work to compare land cover maps for Uganda. I thought this comparison might be interesting to others and asked her to write it up into this blog! So here it is!
I am privileged to have been invited to post on Catherine's blog, which I particularly enjoy reading for frank insights that are much easier to absorb and relate to than many of the dry research reports I have read elsewhere. A bit about myself - I am Joanne Morris, working for the Stockholm Environment Institute at the University of York, UK. I am broadly interested in natural resource use and management in semi-arid and arid regions, for balancing the demands for food, energy, livelihood and above all looking after the natural resource base so that we can continue providing for those demands into the future. I am especially interested in the use of biomass for agriculture, livestock and energy (e.g. as mulch, manure, compost, feed, fuel for burning, or biogas) - what is the most effective use of biomass to serve all three? And which form of biomass is best to use?
Anyway, back to the actual question at hand: during the year, we had to choose a landuse map to use as the base for the calculations we are doing for the Uganda pig value chain in Hoima. Perhaps you and others will be interested in the comparison of current landcover products out there that led to our final choice to use the SERVIR-Uganda 2000 Scheme II map.
From Google, a USGS list of Land Cover Data Links for Africa and a good review paper of global land cover maps (Gong et al 2013), I gathered the following list of possible candidates with some of their key features. We were interested in the resolution first and foremost - within even 1km in Uganda we saw very different landcovers, with fields mixed in with natural forest, unlike in Europe or the US where you can have fields of wheat of maize stretching for thousands of hectares. Therefore, ideally we needed a product with a higher resolution than 1km. Second was the date of the data - landuse changes quickly in Africa - as we found on our field trip, where large swathes of commercial forest have been planted in the last 10-15 years, so ideally something more recent that the last best global landcover layer which was the Global Land Cover 2000 layer from the JRC. Finally we were interested in how many landcover types were differentiated for Hoima - could we get cropland, bushland and wetland from it, as well as forest?
*dd
= decimal degrees; GLCF – Global Landcover Facility; GLCN –
Global Landcover Network; JRC – Joint Research Centre; AVHRR - Advanced Very
High Resolution Radiometer; FAO – Food and Agricultural Organisation; ESA – European
Space Agency; NASA - National Aeronautics and Space Administration; USGS – US Geological
Survey; IFPRI – International Food Policy Research Institute; IGBP – International
Geosphere-Biosphere Programme; LCCS - ; GOFC-GOLD – Global Observations
of Forest and Land Cover Dynamics
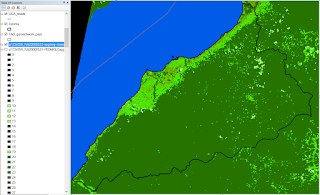
Here are examples of how a selection of the most recent layers look for Hoima. SERVIR came out quite clearly as the most useful because of its high resolution (30m) and the landcover classes resonated with what we saw on a round route drive through the district - that much of the area around Hoima town is mixed smallscale crop and bush/ forest land, while towards the south it gets drier and more bushland. Along the lake shore was very dry with no fields. The only landcover missing is the large commercial pine and eucalyptus forests that we saw on our drive. It would be ideal if it was Africa wide so that we could very easily transfer our calculations to another country without worrying about the change in landcover maps, perhaps by the time we move away from the ESA (East and Southern Africa) countries, SERVIR will have expanded :)
SERVIR - Scheme 2, 2000
The SERVIR Land Cover maps were developed for Green Houses gases Inventories to provide baseline data for Land use, land-use change and forestry (LULUCF) sector for each country, and were developed with country representatives, informed by country specific interest, definitions, descriptions, mapping goals and policy statements and documents with guidance from IPCC Good Practice guidelines.
SERVIR Scheme I - 6 IPCC classes: Forestland, Grassland, Wetland, Cropland, Settlement and Other land; Scheme II - 14 classes
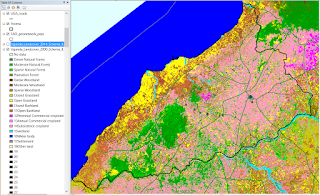
SERVIR - Scheme 2, 2014
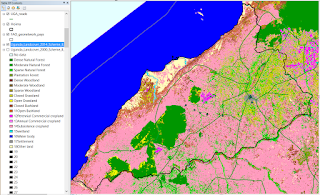
GlobCover - 2009, Uganda
GlobCover is an ESA initiative which began in 2005 in partnership with JRC, EEA, FAO, UNEP, GOFC-GOLD and IGBP, and incorporates input from the global community. The aim of the project was to develop a service capable of delivering global composites and land cover maps using as input observations from the 300m MERIS sensor on board the ENVISAT satellite mission. ESA makes available the land cover maps, which cover 2 periods: December 2004 - June 2006 and January - December 2009.
We decided not to use it because it is not as detailed within Hoima as SERVIR.
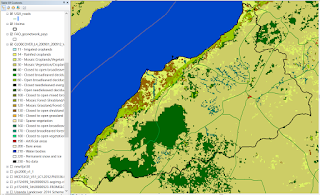
GlobCover SHARE
The GlobCover SHARE dataset was created by FAO-Land and Water Division, in partnership with various institutions, and makes use of several sources (GLC-Share report ):
We decided not to use it because of the coarse resolution (1km).

GLCN - Africover
Cultivated-agriculture layer highlighted above the general landcover layer .
The Africover map is highly detailed, however, the legend is quite confusing to decipher, and therefore SERVIR was chosen for ease of handling.
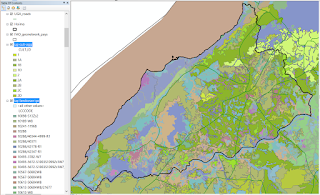
IFPRI
We chose not to use this map as the data is a bit old (2000) and the resolution too coarse (1km).
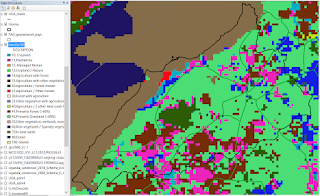
MODIS
Although very good for time-series, because it is available for every year at quite fine resolution (500m), is it still not as detailed as SERVIR, so we decided not to use it.
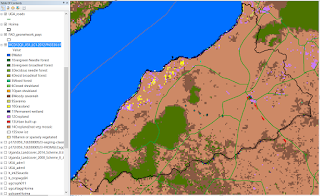
GLC-2000
GLC 2000 makes use of the VEGA 2000 dataset: a dataset of 14 months of pre-processed daily global data acquired by the VEGETATION instrument on board the SPOT 4 satellite, made available through a sponsorship from members of the VEGETATION programme, including JRC.
As the data is from 2000, it is too old for our purposes.
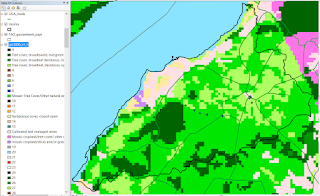
FROM-GLC
Although great for a forest/bushland study, we are more interested in the cropland and wetland landcovers, so we decided not to use this map.
I was pleasantly surprised and impressed at the range of data out there - openly accessible - with varying characteristics to suit different purposes. At national level there will no doubt be many more! The GlobCover SHARE project will be one to watch - the 2014 beta is out, although I did not yet find the data. And here's to hoping SERVIR continue expanding their maps to more countries! Merry Christmas all.
On a side note, I would have done a follow-up comparison of precipitation maps out there, but NCAR got there first, with a comprehensive set of pages about each of the main datasets available here.
I would like to thank Joanne for having shared her comparison here. The project we have been working on settled to work with the SEVIR map 2000 scheme II. The decision was based on a trade-off between high resolution (30m for SEVIR) and accuracy tested with our validation point from the field.
 |
| Joanne Morris, from SEI York and the author of this post |
Anyway, back to the actual question at hand: during the year, we had to choose a landuse map to use as the base for the calculations we are doing for the Uganda pig value chain in Hoima. Perhaps you and others will be interested in the comparison of current landcover products out there that led to our final choice to use the SERVIR-Uganda 2000 Scheme II map.
From Google, a USGS list of Land Cover Data Links for Africa and a good review paper of global land cover maps (Gong et al 2013), I gathered the following list of possible candidates with some of their key features. We were interested in the resolution first and foremost - within even 1km in Uganda we saw very different landcovers, with fields mixed in with natural forest, unlike in Europe or the US where you can have fields of wheat of maize stretching for thousands of hectares. Therefore, ideally we needed a product with a higher resolution than 1km. Second was the date of the data - landuse changes quickly in Africa - as we found on our field trip, where large swathes of commercial forest have been planted in the last 10-15 years, so ideally something more recent that the last best global landcover layer which was the Global Land Cover 2000 layer from the JRC. Finally we were interested in how many landcover types were differentiated for Hoima - could we get cropland, bushland and wetland from it, as well as forest?
Landcover map
|
Resolution and satellite
source
|
Year and projection of data
|
Coverage – Available for
Uganda?
|
Landcover classes in Hoima
|
0.000271dd (~30m)
Landsat 30m –
supervised classification using maximum likelihood algorithm on
LandSat thematic mapper (LandSat 5, 7 and 8 – Uganda)
|
2000 & 2014 (Uganda)
2000, 2005, 2010 – other countries
WGS 1984
|
Uganda Land Cover 2014 Scheme I and Scheme II
same for 9 (ESA) countries namely: Ethiopia, Botswana, Lesotho,
Malawi, Namibia, Rwanda, Tanzania, Uganda, and Zambia.
|
Scheme II – 14 classes
Scheme I – the 6 IPCC classes
|
|
FROM-GLC -
(Finer
Resolution Observation and Monitoring of Global Land Cover)
|
30m
Landsat Thematic Mapper (TM) and Enhanced Thematic Mapper Plus (ETM+)
|
mainly 2009-2010, filled with 2007, few 1998
|
Global
|
Level 1 –11 classes
Level 2 –25 classes to combine with L1
predominantly forest, doesn’t differentiate in Hoima well enough
|
GLCN Africover (FAO)
|
na (shapefile)
LANDSAT
TM images (Bands 4,3,2)
|
mainly 2000 (Uganda)
- shapefile, not raster
WGS 1984
|
Africover Eastern Africa module, 10 countries:
Burundi, Democratic Republic of Congo, Egypt, Eritrea, Kenya, Rwanda, Somalia, Sudan, Tanzania and Uganda |
LCCS classification, 8 major landcover classes, can download all or selections e.g. agriculture
|
GLCN Globcover-SHARE (FAO)
|
30 arc second/
0.00833dd (~1km)
combination – see comments
|
varies by country – 1990 – 2012
WGS 1984
|
Global
|
Thematic layers: 10
LCCS classification
|
GLCN Globcover by country (ESA) - Uganda
|
~300m/ 0.00278dd,
ENVISAT, 300m MERIS sensor
|
2005 and 2009
|
Africa
|
46 LCCS classes
Cropland by lake
|
GLCF MODIS (NASA/ USGS)
|
raw tiles: 0.0041667dd (~500m) OR
5’ (~10km)
or 0.5dd (~60km) – aggregated
|
2001 – 2012 (every year)
|
global – by tile: Uganda PN3536
|
16 classes
IGBP classification
|
GLC 2000 (JRC)
|
0.00893dd (~1km)
SPOT 4, VEGETATION instrument
|
2000
WGS 1984
|
World
|
22 categories -
LCCS classification
no wetland,
cropland mainly by lake
|
30 arc seconds, 0.00833 (~1km)
based on a reinterpretation of the Global Land Cover Characteristics Database (GLCC ver. 2.0), EROS Data Centre (EDC, 2000)
|
2000
GCS_Clarke_1866
|
World
|
17 classes
IGBP classification
agriculture focus
no wetland shown
|
|
1km, resampled to 0.25, 0.5 and 1.0 degree grids
AVHRR
|
1992-1993
geographic
|
Global
|
17 classes, IGBP classification
|
|
University of Maryland (UMD)
|
1 degree, 8 kilometer and 1 kilometer pixel resolutions
AVHRR
|
1981-1994
|
Global
|
14 classes
|
Scale of 1:100 000
|
1990 and 2000
|
Europe
|
44 classes
|
|
AVHRR – Global Land Cover Characterisation
|
AVHRR – 1km
|
1992 – 1993
|
Global
|
7 classes
|
GOFC/ GOLD Land Cover Project office
|
Here are examples of how a selection of the most recent layers look for Hoima. SERVIR came out quite clearly as the most useful because of its high resolution (30m) and the landcover classes resonated with what we saw on a round route drive through the district - that much of the area around Hoima town is mixed smallscale crop and bush/ forest land, while towards the south it gets drier and more bushland. Along the lake shore was very dry with no fields. The only landcover missing is the large commercial pine and eucalyptus forests that we saw on our drive. It would be ideal if it was Africa wide so that we could very easily transfer our calculations to another country without worrying about the change in landcover maps, perhaps by the time we move away from the ESA (East and Southern Africa) countries, SERVIR will have expanded :)
SERVIR - Scheme 2, 2000
The SERVIR Land Cover maps were developed for Green Houses gases Inventories to provide baseline data for Land use, land-use change and forestry (LULUCF) sector for each country, and were developed with country representatives, informed by country specific interest, definitions, descriptions, mapping goals and policy statements and documents with guidance from IPCC Good Practice guidelines.
SERVIR Scheme I - 6 IPCC classes: Forestland, Grassland, Wetland, Cropland, Settlement and Other land; Scheme II - 14 classes

SERVIR - Scheme 2, 2014

GlobCover - 2009, Uganda
GlobCover is an ESA initiative which began in 2005 in partnership with JRC, EEA, FAO, UNEP, GOFC-GOLD and IGBP, and incorporates input from the global community. The aim of the project was to develop a service capable of delivering global composites and land cover maps using as input observations from the 300m MERIS sensor on board the ENVISAT satellite mission. ESA makes available the land cover maps, which cover 2 periods: December 2004 - June 2006 and January - December 2009.
We decided not to use it because it is not as detailed within Hoima as SERVIR.

GlobCover SHARE
The GlobCover SHARE dataset was created by FAO-Land and Water Division, in partnership with various institutions, and makes use of several sources (GLC-Share report ):
- Global Landcover Datasets: Globcover 2009 (MERIS 300m), MODIS VCF (Vegetation Continuous Fields), CROPLAND Hybrid database (mixed resolution), GLC2000 (SPOT Vegetation 1km), Mangroves (Landsat 30m, FAO Global Database of Mangroves)
- By country – variety of satellite sources, including: Landsat 30m, MODIS 250m, FAO LCCS, SPOT 10m, AirPhotos 1m, Ikonos 4m – majority is Landsat 30m
We decided not to use it because of the coarse resolution (1km).

GLCN - Africover
Cultivated-agriculture layer highlighted above the general landcover layer .
The Africover map is highly detailed, however, the legend is quite confusing to decipher, and therefore SERVIR was chosen for ease of handling.

IFPRI
We chose not to use this map as the data is a bit old (2000) and the resolution too coarse (1km).

MODIS
Although very good for time-series, because it is available for every year at quite fine resolution (500m), is it still not as detailed as SERVIR, so we decided not to use it.

GLC-2000
GLC 2000 makes use of the VEGA 2000 dataset: a dataset of 14 months of pre-processed daily global data acquired by the VEGETATION instrument on board the SPOT 4 satellite, made available through a sponsorship from members of the VEGETATION programme, including JRC.
As the data is from 2000, it is too old for our purposes.

FROM-GLC
Although great for a forest/bushland study, we are more interested in the cropland and wetland landcovers, so we decided not to use this map.

I was pleasantly surprised and impressed at the range of data out there - openly accessible - with varying characteristics to suit different purposes. At national level there will no doubt be many more! The GlobCover SHARE project will be one to watch - the 2014 beta is out, although I did not yet find the data. And here's to hoping SERVIR continue expanding their maps to more countries! Merry Christmas all.
On a side note, I would have done a follow-up comparison of precipitation maps out there, but NCAR got there first, with a comprehensive set of pages about each of the main datasets available here.
I would like to thank Joanne for having shared her comparison here. The project we have been working on settled to work with the SEVIR map 2000 scheme II. The decision was based on a trade-off between high resolution (30m for SEVIR) and accuracy tested with our validation point from the field.